Counterfactual Explanations for Sustainable Tourism Indicators: Implementation in a Shiny Application

XLI Congreso Nacional de Estadística e Investigación Operativa

E. López Cano1, J. Saugar1, C. Lancho Martín1, M. Cuesta2, I. Martín de Diego1, A. Amado3

(1) Data Science Laboratory, Universidad Rey Juan Carlos; (2) Universidad Carlos III; (3) Dephimáticas, S.L.

XML & Sustainable Tourism Indicators

Publication

Saugar, J., Lancho, C., Cuesta, M., Cano, E.L., de Diego, I.M., Amado, A. (2025). Counterfactual Explanations for Sustainable Tourism Indicators. In: Julian, V., et al. Intelligent Data Engineering and Automated Learning – IDEAL 2024. IDEAL 2024. Lecture Notes in Computer Science, vol 15346. Springer, Cham. https://doi.org/10.1007/978-3-031-77731-8_20

Explainable Machine Learning

  • provide simple explanations on complex Machine Learning (ML) models.

Counterfactuals

Through understandable “what if” scenarios, counterfactuals explore how changes in the input data affect the results of a model

Sustainable tourism indicators

  • Indicators such as “Average expense”, “Average stay”, “Percentage of tourism in GDP”, are classified into Dimensions.

  • Indicators are scaled using a given method (z-score, Min-Max, or distance to a reference value). Let \(x_j\) be such scaled indicators.

  • A composite indicator by dimension \(y\) is computed then as a weighted average:

\[y = \sum_{j=1}^{p} w_j x_j\]

  • The Global Sustainable Tourism Indicator (STI) is the weighted average of the dimensions indicators:
\[STI = \sum_{j=1}^{p} w_j x_j\]

Question to answer

What indicators does a destination need to change in order to improve the STI by a given amount?

  • Find the minimum and plausible changes \(\beta_j\) that can be made to the input variables \(x_j\) to achieve a desired change \(\varepsilon\) in the global indicator \(y\):

\[y' - y = \sum_{j=1}^{p} w_j (x_j + \beta_j) - \sum_{j=1}^{p} w_j x_j \geq \varepsilon\]

Model

\[\begin{align} \min \quad & \sum_{j=1}^{p} \beta_j + \lambda \sum_{j=1}^{p} \delta_j \label{f_obj} \\ \textrm{s.t.} \quad & y' - y = \sum_{j=1}^{p} w_j (x_j + \beta_j) - \sum_{j=1}^{p} w_j x_j \geq \varepsilon \label{y_epsilon} \\ %& \beta_j \leq a \cdot f_{std}(x_j), & \forall j = 1,\dots,p \label{beta_std} \\ & x_j + \beta_j \leq 1, & \forall j = 1,\dots,p \label{x_j_max1} \\ & \mu_{l} \leq \sum_{j=1}^{p} \delta_j \leq \mu_{u} \label{num_var_change} \\ &\beta_j \leq a f_{std}(x_j) \delta_j & \forall j=1,\dots,p \label{beta_binary} \\ % & \delta_j \leq \beta_j \leq m \delta_j & \forall j=1,\dots,p \label{beta_binary} \\ & \delta_j \in \{0,1\} & \forall j=1,\dots,p \label{delta_binary} \\ &\beta_0, \dots, \beta_p \geq 0, \ \beta_0, \dots, \beta_p \in \mathbb{R} \label{beta_0_real} \\ & \lambda \geq 0, \lambda \in \mathbb{R} \label{m_constant_large_enough} \end{align}\]

Model

  • The objective function \(\sum_{j=1}^{p} \beta_j + \lambda \sum_{j=1}^{p} \delta_j\) minimizes the changes made over the input variables (\(\beta_j\)), and the number of variables where a change is made (\(\delta_j\)).
  • Constraint \(y'-y \geq \varepsilon\) ensures that the new value \(y'\) of the indicator has increased in at least \(\varepsilon\), addressing the validity property.
  • To guarantee the plausibility property, constraint \(\beta_j \leq a f_{std}(x_j) \delta_j\) establishes the maximum change admitted in every variable \(x_j\) through a function \(f_{std}(\cdot)\) of its corresponding standard deviation. \(\delta_j \in \{0,1\}\) are binary variables controling which input variables some changes are made.
  • The actionability property is ensured with constraint \(x_j + \beta_j \leq 1\), which maintains each variable \(x_j\) within \([0,1]\).
  • Constraint \(\mu_{l} \leq \sum_{j=1}^{p} \delta_j \leq \mu_{u}\)controls the minimum and maximum number of \(x_j\) variables where a change is admitted.

The formulation of the problem involves different user-fixed parameters (\(\lambda\), \(\varepsilon\), \(f_{std}(\cdot)\), \(\mu_l\), \(\mu_u\) and \(a\)) that allow its adaptation to different scenarios, depending on the domain requirements.

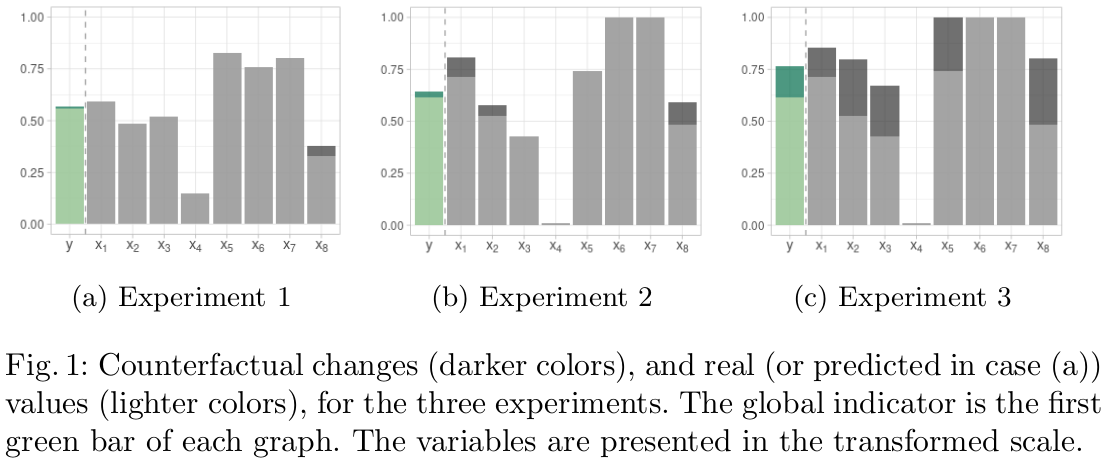
Example

Implementation

Context: EVASTUR

  • I+D+i project with the company Dephimática

  • Experts in public statistics

  • Sustainable tourism indicators system: Exploration, Visualization, Analysis

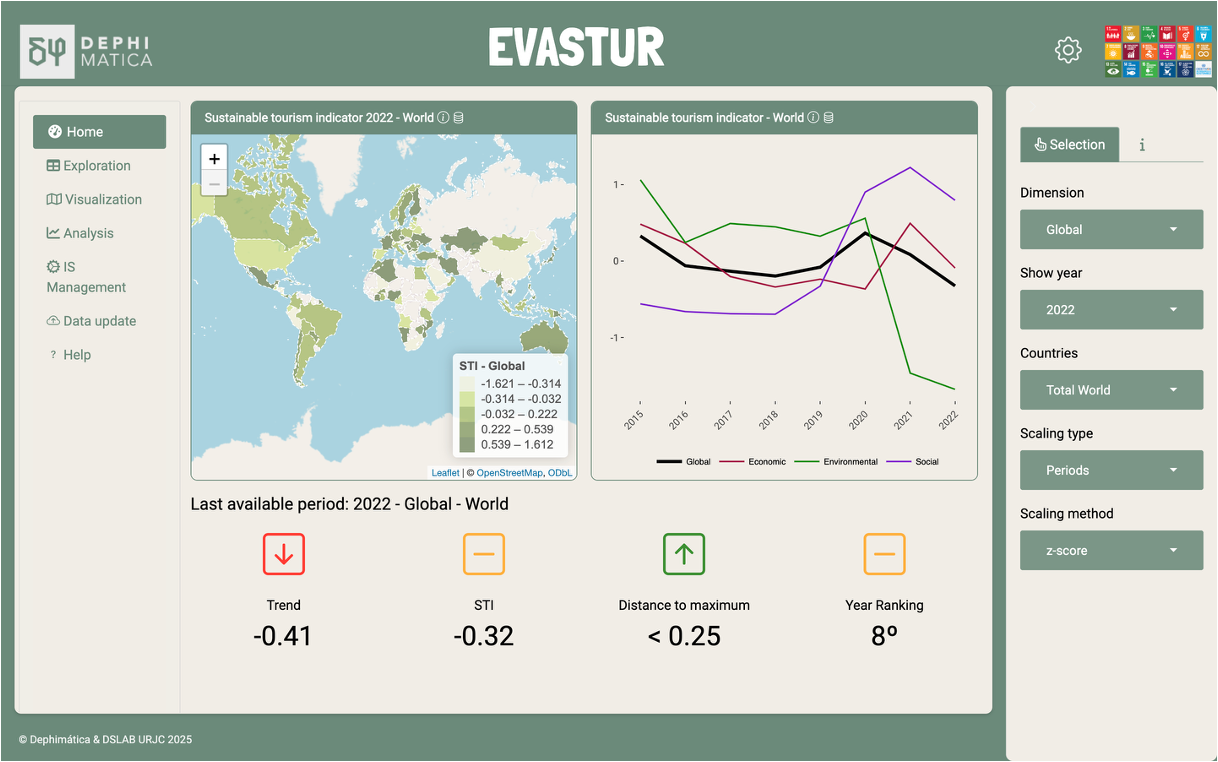
EVASTUR - Dashboard
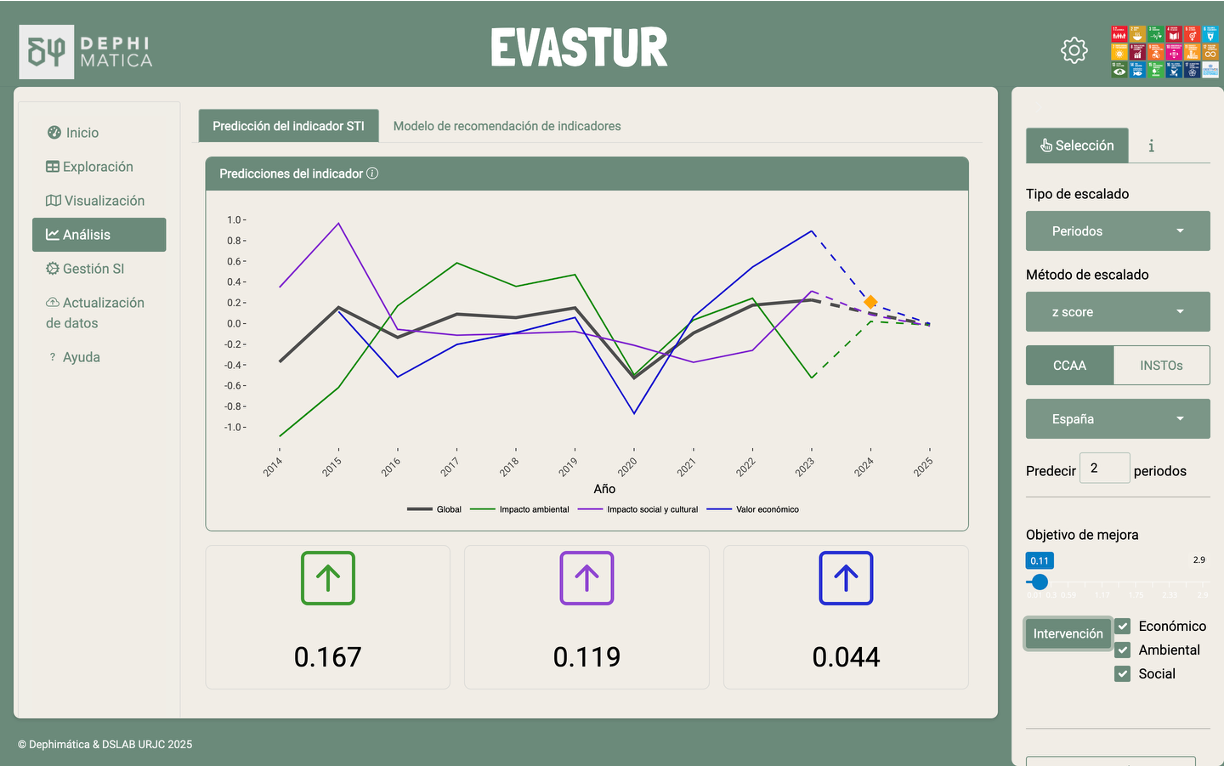
EVASTUR - Analysis
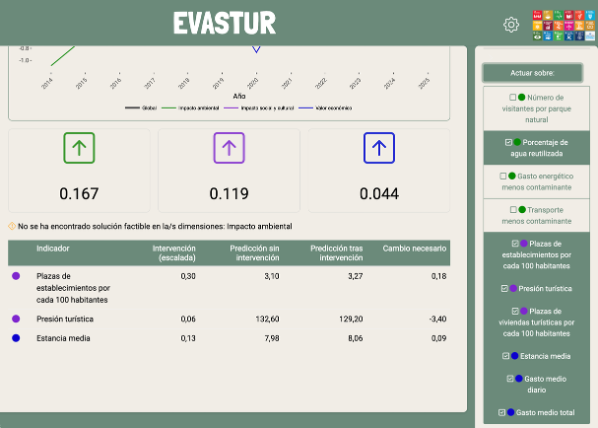
EVASTUR - Intervention
Conclusions and future work

Conclusions

  • Success story with real impact

  • Using only Open Source Software, including R

  • Real knowledge transfer

Future work

  • Include more complex prediction models

  • Give information about the variables that build the indicator

  • Continuous improvement of the app

  • Find partners that use the dashboard

Thanks!

carmen.lancho@urjc.es

emilio.lopez@urjc.es

@DSLAB_URJC

https://www.datasciencelab.es

Slides: https://urjcdslab.github.io/seio2025_counterfactual


Questions

Acknowledgements: Spanish Ministry of Science and Innova- tion, under the Knowledge Generation Projects program: XMIDAS (Ref: PID2021- 122640OB-100).